WHAT IS YOUR DISTRICT’S COLLEGE ENROLLMENT RATE? …IT DEPENDS [PART II]

In This “Research Insights” Edition
This “Research Insights” edition builds on “What is Your District’s College Enrollment Rate? …It Depends [Part 1]” in our previous issue, where we look at 5 research artifacts on college enrollment outcomes across four school districts participating in NNERPP through their RPPs (see Table 1 below for a list). As we examined the five reports on college enrollment, two things stood out: One, the construction of the sample (i.e., who is included in the study) differed quite a bit in each study, and two, the definition of “college enrollment” varied as well – leading to college enrollment rates that might not lend themselves to direct comparison.
Table 1. List of RPPs + Artifacts Included in This Article
In Part I, we explored in greater detail how the samples across the five studies differed and discussed the implications of this for policymaking. We did include a look at the college enrollment rates for each of the sample constructions. However, we could not yet confidently conclude whether rates across studies with similar sample constructions could in fact be compared, as we had not yet considered how ‘college enrollment’ was defined.
Why This Article
Here, in Part II, we turn to the various definitions of college enrollment across the five studies and address the potential ramifications of these differences for policymaking. Only after considering both the sample constructions and the definitions of college enrollment across the studies can we conclude which –if any– of the studies we might be able to compare directly.
To help us with this assessment, we propose a simple graph as a tool (see Figure 1) to visualize where the studies fall with respect to the sample construction and the college enrollment definition. On the x-axis of the figure, we display the sample construction range, which was the focus of Part I of this series. In particular, our sample construction ranges from 9th graders to high school graduates; specifically, 9th graders, high school seniors, high school seniors that are also high school graduates, and all high school graduates, whether they graduated on time or not. On the y-axis of the figure, we display two college enrollment possibilities, ‘immediate’ or ‘delayed.’ Specific definitions for what we mean by ‘immediate’ and ‘delayed’ to be discussed in the following sections.
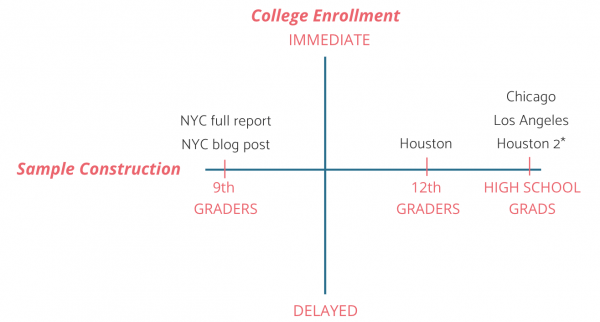
FIGURE 1. Graph of How the Studies are Distributed Along Two Dimensions, by SAMPLE CONSTRUCTION ONLY
For now, we can place the studies only along the x-axis, or sample construction dimension. By the end of the article, we will be able to place them vertically as well — giving us the complete picture about if, and how, some of the studies align. As seen in the figure above, the two New York City studies are based on cohorts of 9th graders in their sample construction and therefore fall at the left end of the x-axis. At the other end of the graph we find the Chicago and Los Angeles studies, whose samples are based on high school graduates. Finally, there are two samples included in the Houston study: 1) high school seniors (placed toward the right end of the x-axis but not as far right as Chicago and Los Angeles), and 2) high school seniors that are also high school graduates (placed at the far-right end of the x-axis, along with Chicago and Los Angeles). Note that we include an asterisk next to the Houston 2 sample construction because although it includes “high school graduates,” similar to Chicago and Los Angeles, the Houston sample additionally is conditioned on high school graduates that were high school seniors on a given date, a constraint that is not included in the Chicago and Los Angeles samples.
As evidenced by the five studies included here, college enrollment is a topic of particular interest to school districts, and by extension, RPPs. School district leaders and decision makers, researchers, and parents enrolling their children are just some of the groups who might want to know a particular district’s college enrollment rate and compare it to other districts. However, both for readers and for producers of research, it is important to carefully consider who is included in the analysis and how outcomes are defined before making simple comparisons even on similarly labeled outcomes. We hope to demonstrate these connections between samples, outcome definitions, and policy implications here — let’s get started on Part II!
What Does “College Enrollment” Mean?
I. IMMEDIATE ENROLLMENT
It is perhaps a common expectation for students who finish high school to immediately enroll in college — that is, the very next semester following high school graduation. Three of the reports define college enrollment in this way — students who enroll in college the fall semester after graduating high school: The Houston study, the New York City blog post, and the Chicago study (note that the Chicago and Houston studies additionally examine delayed enrollment, discussed in section II).
Although it may seem straightforward to simply measure the number of students who immediately enroll in college post-high school, there are a number of additional choices students can make when deciding where to enroll, and these choices might matter for policy considerations: for example, students can choose to attend part-time or full-time, go to a 2-year or 4-year institution, and select from a public or private college. Although several of the studies provide findings related to these additional distinctions, we will limit the discussion here to overall college enrollment rates and focus exclusively on the different time to enrollment windows examined across the reports (i.e., ‘immediate’ or ‘delayed’). We mention these additional variables here to keep in mind when determining the comparability of college enrollment statistics more generally. Finally, note that we limit our discussion to enrollment only, and do not consider persistence or actual degree attainment, which are additional outcomes of interest one could consider.
Defining college enrollment as ‘immediate’ will limit the number of students considered as enrolled, since only those students who enroll right after graduating high school are counted as enrolled. Some students may still enroll in college, but might do so a semester or more later; these students would be considered non-enrollees using the immediate enrollment definition. The choice to define college enrollment in this way should be considered carefully depending on the research question of interest or the policy levers one is interested in exploring. For example, if one is interested in studying the impact of school supports on college enrollment, immediate enrollment as a definition makes the most sense, given that later college enrollment decisions are likely to be influenced by a greater number of factors than schooling supports alone. If any (or ever) college enrollment, within a specified time of high school graduation (e.g., within 6 years), is an important indicator of post-high school success, then immediate college enrollment may not be the right definition for the study.
Even among the three studies listed here, which all examine college enrollment in the fall following high school graduation, we must keep in mind that findings might not be directly comparable, since the construction of the sample differs across the studies: As discussed in greater detail in Part I of this series, the Houston study includes any student that was a 12th grader in the fall of a particular year in its base sample and additionally then also examines high school graduates from their base sample; the New York City blog post considers 9th grade students within a given cohort as the starting point for their sample, and the Chicago report contains only high school graduates in its sample. These are very different starting points and will affect the reported college enrollment rates. Another difference to keep in mind is how the studies define ‘fall enrollment,’ which can differ depending on both the data source and coding decisions. We don’t detail these here but encourage readers to visit each report for information on data sources used and coding decisions made.
>> IMMEDIATE ENROLLMENT | FINDINGS
Figure 2 shows the overall college enrollment rates for Houston (we include the rates for the two different samples examined in the study), New York City, and Chicago, with college enrollment defined as “enrolled immediately after high school graduation.” Note that these rates are the overall rates and do not distinguish between the various categories described earlier (i.e., part-time versus full-time, 2-year versus 4-year, private versus public).
We place these findings along the same “Sample Construction” continuum we defined earlier in Figure 1, with 9th graders on the far left-hand side and high school graduates on the far right-hand side. Because these results are not directly comparable given the sample constructions, we do not include the numerical findings on each bar; rather, we invite you to focus on the patterns of the bars themselves.
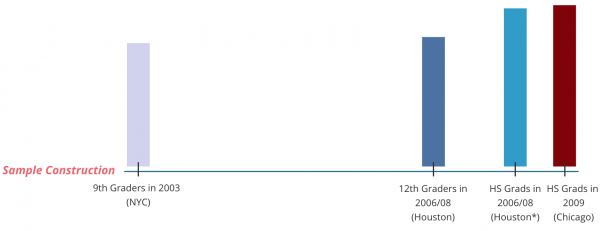
FIGURE 2. Immediate College Enrollment, by Sample Construction
From the figure above, notice that the enrollment rates for high school graduates in Houston and for high school graduates in Chicago for similar years are almost identical and higher than the enrollment rates for 12th graders in Houston and 9th graders in New York City. This confirms what we might expect to see given these different constructions of the samples. The freshmen sample is the most inclusive of the group, so we would expect a relatively lower college enrollment rate overall. In comparison, the sample of high school graduates in Houston and Chicago are restricted to only those students who have already successfully mastered all steps in the high school pipeline, which, relative to the 9th grade sample consists of a very different set of students. We thus would expect to see higher rates of college enrollment rates for these sample constructions.
>> IMMEDIATE ENROLLMENT | IMPLICATIONS
From a policy perspective, defining college enrollment as immediate enrollment following high school graduation may provide information on how well high schools are preparing students to continue on to college. For example, results from research questions using this outcome might inform district efforts that range from helping students navigate the college application process to preparing students for the rigorous college curriculum.
II. DELAYED ENROLLMENT
Next, we turn to the studies that allow for a longer time window in which students can enroll in college. The Los Angeles report includes students who enroll in college within one year of high school graduation, while the New York City full report extends the time frame even further, and includes students who enroll in college within 5 semesters of expected high school graduation. Both the Houston and Chicago studies included in the previous discussion of immediate college enrollment also examine enrollment within six years of high school, so we include those two here as well.
For all of these reports, we might expect college enrollment rates to be relatively higher than what we observed from the previous studies using immediate college enrollment as the cutoff. However, we still must consider the construction of the sample in each of these studies. As detailed in Part I of this two-part series, the Los Angeles study and the Chicago study include only high school graduates in their samples. When examining delayed college enrollment, the Houston report limits its 12th grade base sample to those students who graduated (note that due to the different starting point, this sample construction is not the same as the sample construction for Los Angeles and Chicago). The NYC report (like the NYC blog post discussed previously) includes the entire freshman cohort (note that the NYC report looks at college enrollment rates of freshmen who finish high school within six years, while the NYC blog post looks at college enrollment rates of freshmen who complete high school within four years).
Knowing now that none of these studies share the exact same sample construction and the exact same definition of college enrollment, we can say with confidence that a simple comparison across reports is not possible. We do think there is still value in engaging in a discussion of the relative difference in rates, taking into account these two different dimensions of the research, however, and so take that up next.
>> DELAYED ENROLLMENT | FINDINGS
Figure 3 shows the college enrollment rates from the studies that examine delayed college enrollment (i.e., college enrollment that occurs within 2 semesters post-high school to college enrollment within 6 years post-high school). Once again, we use the “Sample Construction” continuum defined in Figure 1 to place the findings, do not record numerical results on the bars, and will focus on the patterns instead. Note that comparisons across the studies cannot be made — with the exception of the two bars for Los Angeles (enrollment for graduates in 2008 versus enrollment for graduates in 2014) and the two bars for New York City (enrollment for freshmen in 2003 versus enrollment for freshmen in 2008). In both cases, the results come from the same study with the same sample construction and definition of college enrollment, respectively. For both of these pairs of studies we see that college enrollment rates increased over time.
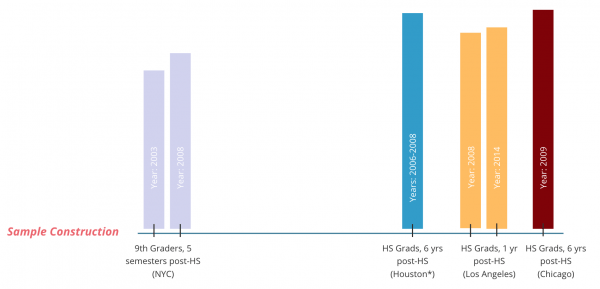
FIGURE 3. Delayed College Enrollment, by Sample Construction
An additional observation we can make from this figure is that enrollment rates for the widest definition of college enrollment (i.e., the longest time frame: 6 years) and a narrow sample construction (i.e., high school graduates) are the highest bars from the group of studies, as we might expect. This group of students has not only completed the entire high school pipeline, they have also been given a generous time window within which to be considered “enrolled.”
Finally, we can also compare findings within the two studies that examined both immediate and delayed enrollment: Chicago and Houston. In Figures 4 and 5, we see that widening the definition of college enrollment resulted in much larger college enrollment rates for both Houston and Chicago, respectively.
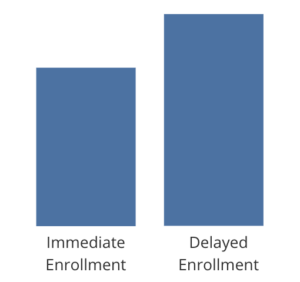
FIGURE 4. College Enrollment: Houston, high school graduates (based on 12th grade sample) in 2006/08
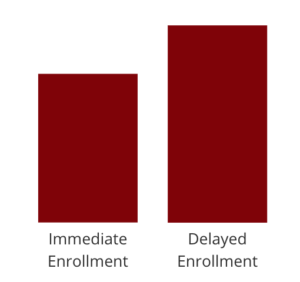
FIGURE 5. College Enrollment: Chicago, high school graduates in 2009
>> DELAYED ENROLLMENT | IMPLICATIONS
From a policy perspective, expanding the definition of college enrollment to include a longer time window in which students can enroll in college may be beneficial to understanding the overall tendency for students to pursue higher education post-high school. Perhaps more importantly, by capturing non-traditional, but increasingly more common, pathways to and through college, such as delayed and interrupted enrollment, more students’ journeys to enrollment are included and acknowledged. These additional pathways might otherwise be missed, especially when focusing the study only on students who enrolled immediately post-high school. The choice of how wide or narrow to allow the definition of college enrollment to be in a given study will depend on the research question of interest, as well as the policy levers one is interested in exploring.
Closing Thoughts
We’ve now come full circle in this two-part series, examining both the construction of the initial samples used in the five reports we examined (i.e., Part I) and the varying definitions of college enrollment employed throughout the studies (i.e., Part II). In Part I, we observed a range of sample choices across the studies, with some studies sharing the same sample constructions. Despite these similarities, we could still not be confident of the comparability of the findings given the potential differences in the definitions of college enrollment across studies. In Part II, we confirmed a number of different definitions for college enrollment. Generally speaking, these definitions fall into two categories: immediate enrollment and delayed enrollment.
We now turn back to the graph we introduced (Figure 1) at the beginning of the article to help us visualize how the studies compared across the two dimensions identified: sample construction and enrollment definition. Figure 6 now shows the placement of the studies we’ve examined in this series along both axes/dimensions. The now-completed graph confirms what the previous sections have suggested: No two studies examined in this article can be directly compared, because no two studies share both the same exact sample construction and the same exact definition of college enrollment. The Chicago and Houston studies come close in their examination of delayed college enrollment, but ultimately the sample constructions are not exactly alike (i.e., the Chicago study examines graduates, while the Houston study examines graduates out of a 12th grade base sample). The two New York City studies, which seemed to closely align in the partially filled-in version of the matrix, are now in two different quadrants altogether.
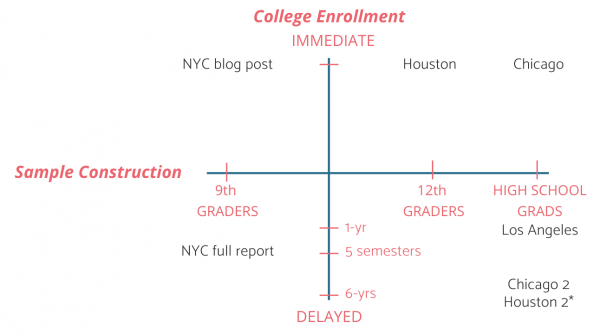
FIGURE 6. Graph of How the Studies are Distributed Along Two Dimensions
As highlighted throughout this two-part Research Insights series, each sample construction and college enrollment definition in the featured studies offers unique insights into particular questions and policy levers of interest. Indeed, the choices made in terms of these two dimensions reflects not only the priorities of the practice-side partners, as we would expect in studies produced in partnership, but also the very practical matter of being limited to certain questions given the data sets the teams have access to. It is thus not a given that findings from studies that pose similar research questions would be easily comparable.
There is, however, an argument to be made for constructing common samples and defining similar college enrollment outcomes: districts would be able to ask each other “What is your district’s college enrollment rate?” and get a clearer sense for how their students compare to similar districts. So rather than a resulting discussion of “It depends,” districts might instead have the opportunity to engage in a meaningful discussion of promising strategies, policies, and interventions they have tried in their contexts. Until then, we hope this series serves as a roadmap of sorts for how to navigate studies with uniquely constructed samples and locally defined college enrollment outcomes!
Paula Arce-Trigatti is Director and Nina Spitzley is Program Administrator of the National Network of Education Research-Practice Partnerships (NNERPP).
Suggested citation: Arce-Trigatti, P., & Spitzley, N. (2019). What is Your District’s College Enrollment Rate? …It Depends [Part II]. NNERPP Extra, 1(4), 2-8. https://doi.org/10.25613/0R6V-2Y87