HOW TO CREATE INCLUSIVE DATA VISUALIZATIONS

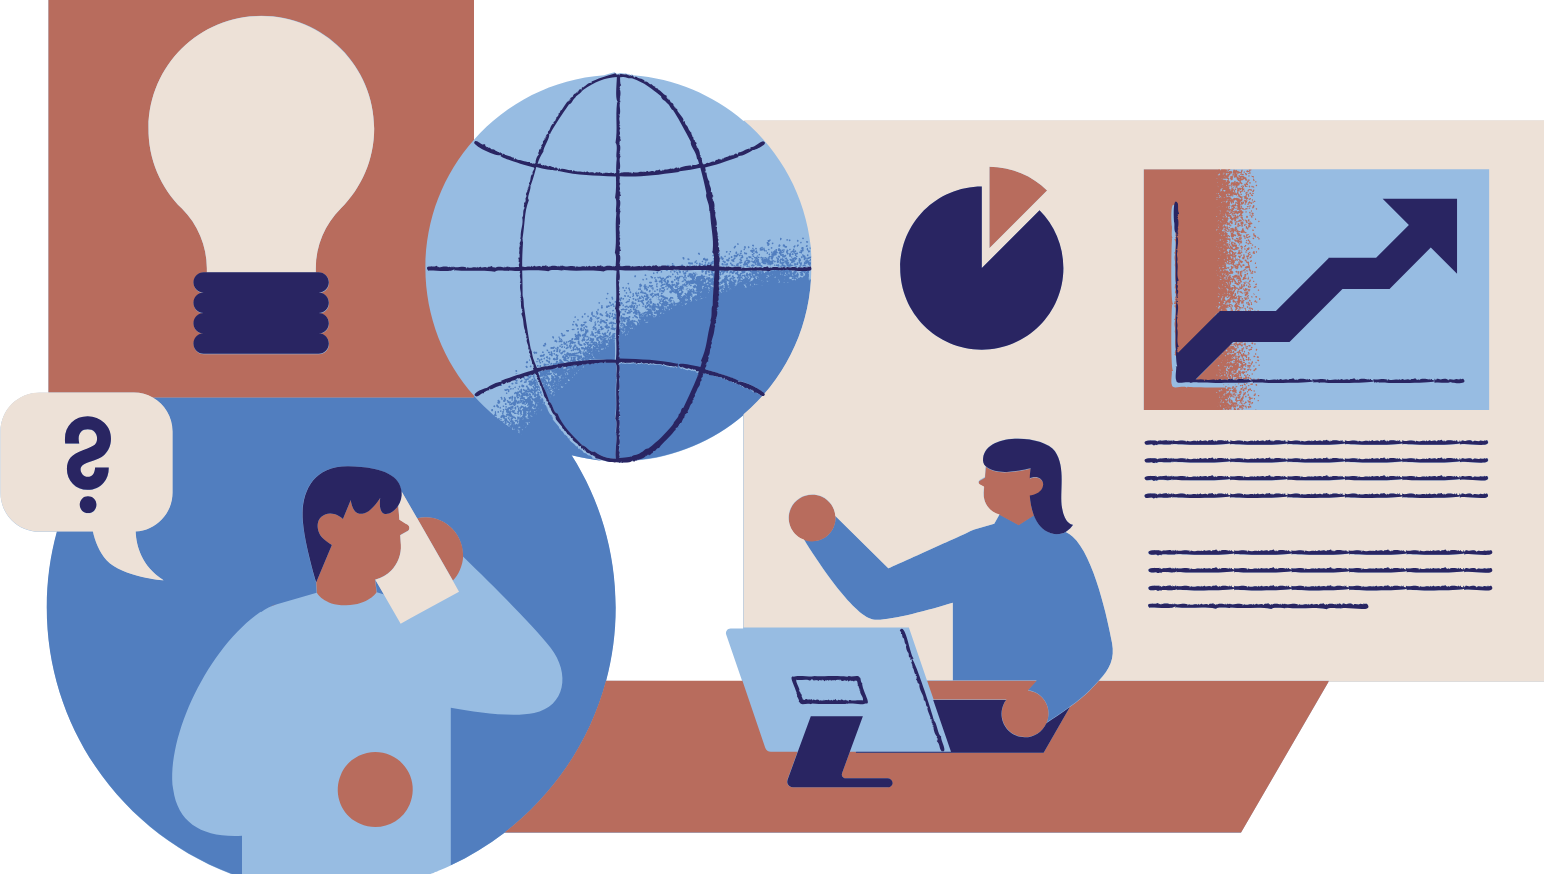
Data visualization is a powerful tool that can help explore and analyze data. It allows you to take many data points and look for patterns and trends.
But what about the data points themselves? What are they and what do they represent?
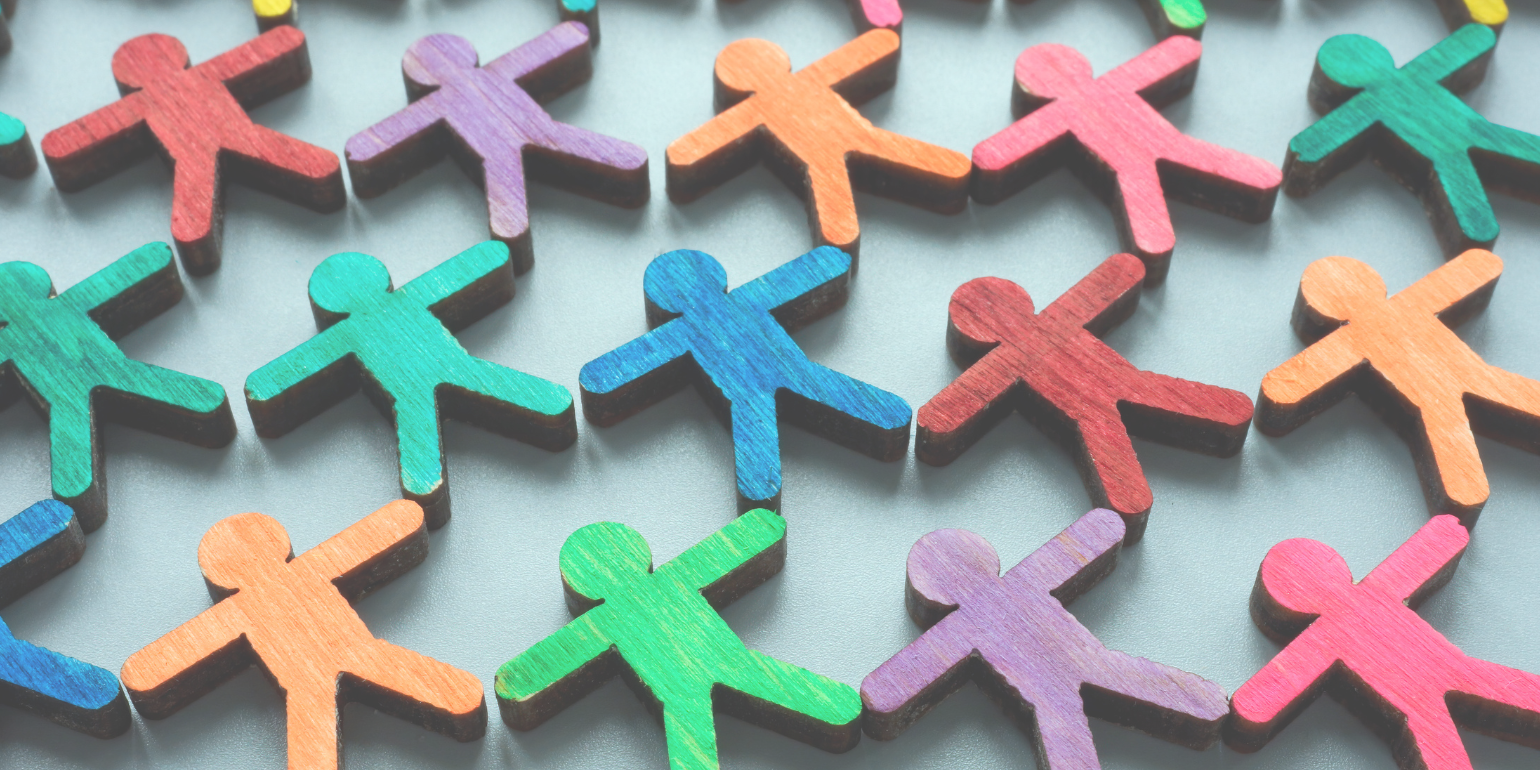
When working with data, it is important to remember what is behind the data points. Data does not exist on its own. It can only be generated by the contributions of people and places – whether they share their own information or are the ones who are collecting that information.
As a result, in order to respect and empower the people who are represented in the data or providing their labor to gather, prepare, and visualize the data, it is critical to implement inclusive data visualization practices. Here, I share some practices for creating inclusive and equitable data visualizations.
Framing
To set up the rest of this article, I’ll first look at a more theoretical framing, then share some concrete examples of inclusive practices.
Giorgia Lupi, a co-creator of the Dear Data series, writes:
“Data represents real life. It is a snapshot of the world, in the same way that a picture catches a small moment in time. Numbers are always placeholders for something else, a way to capture a point of view — but sometimes this can get lost. Failing to represent these limitations and nuances and blindly putting numbers in a chart is like reviewing a movie by analyzing the chemical properties of the cellulose on which the images were recorded.”
[Lupi, G. Data Humanism, The Revolution will be Visualized. http://giorgialupi.com/data-humanism-my-manifesto-for-a-new-data-wold]
This concept sets up the idea that data are a proxy for real people, places, and things. When we manipulate the data (such as when we “clean,” “wrangle,” and “tidy” data), we move further away from those people, places, and things.
Let’s look at an example: the U.S. Census. A person fills out a form that uses standard U.S. Census definitions and options for race. In this case, let’s say they identify as white. However, if you had asked the person to fill out a short answer question about their race, they would have identified as Iranian, ethnically Persian, which is a very different answer.
When we look at how the United States defines race, we see that “white” actually comprises of large groups of people who likely have different lived experiences, bodies, and histories. There are only a few racial categories defined in the Census, which are not sufficient to capture the full identities of people. This oversimplification of racial data makes it very easy for computers to process and for analyzers to make comparisons, but fails to recognize the full depth of individual histories and identities. This can also erase entire groups of people and create harm if those who are contributing to the data do not feel seen in the data. When working on a visualization, remember to ask yourself: Who is being prioritized in this visualization? Who is being erased? Is anyone being harmed if I create this visualization?
What can I do about it?
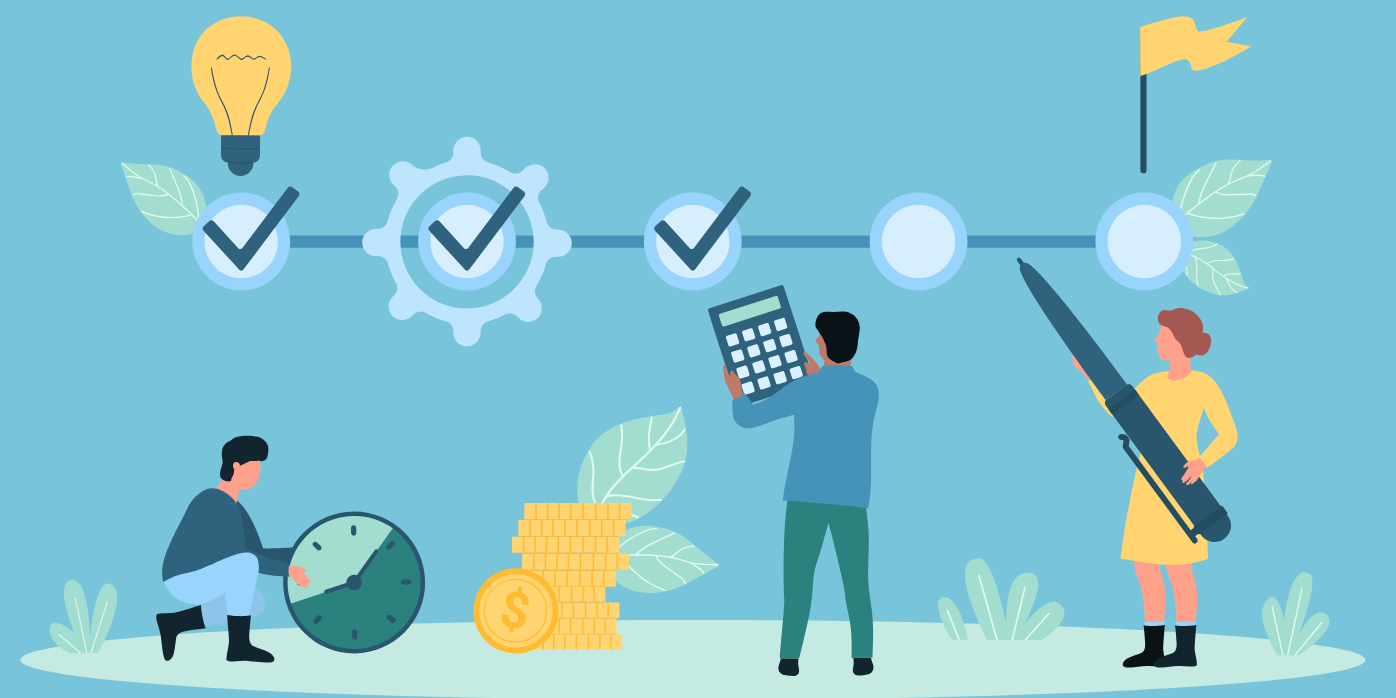
Although there are often structural issues with how we collect data that we can’t control, there are choices we can make as individuals to be more inclusive in our data visualizations. This is not a comprehensive list, but can hopefully serve as a good starting point!
- Collaborate with others to include multiple perspectives and be transparent in the decisions that you make when you collect, analyze, and visualize the data. For example, you can note in the data visualization if some important decisions were made that affect what is seen in the visualization.
- Put care into how you speak about your data by using inclusive language and labels. Titles and labels are often the first thing that readers of your visualization will see, so using inclusive and transparent language there is crucial.
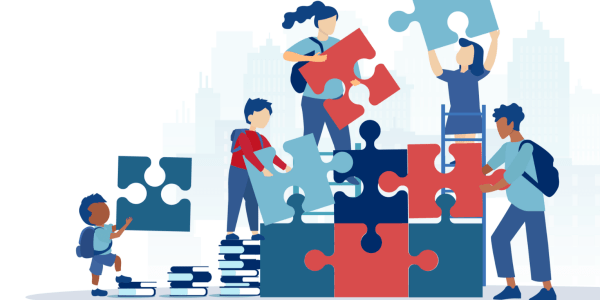
- Represent the people who have contributed to your data and share data with the community that you are working with throughout the process.
- Remember that icons and images can reinforce stereotypes. Select inclusive visuals that do not reflect social inequities.
- Ask yourself: What do the readers of my visualization see when they first look at it? What they see first can often set the benchmark upon which they judge other categories. For example, “white” is often the first option in questions about race in the Census and the first data point in visualizations, which creates a divide between those who respond as white and other racial categories. Some alternatives to categorizing by size are to categorize alphabetically, by stakeholder group, and so on.
- When reading or creating a map, it can help to think about who created the borders of the map – both historically and in whoever created the base layer of the map. Who is missing in the labels, and who is made invisible based on the decisions around borders?
In conclusion, the biggest help is to pause, think critically about your data and the people behind it, and prioritize inclusivity.
Where can I read more?
There are many people who are working in the data visualization field who are also concerned about inclusion and visualization. A few recommended readings are listed below:
- “Abigail Echo-Hawk on the Art and Science of ‘Decolonizing Data’” by Manola Secaira (2019)
- “Data Humanism, The Revolution will be Visualized” by Giorgia Lupi (2017)
- “A Primer on Non-Binary Gender and Big Data” by Catherine D’Ignazio (2016)
- “What would feminist data visualization look like?” by Catherine D’Ignazio (2015)
Negeen Aghassibake is Data Visualization Librarian at the University of Washington Libraries.
Suggested citation: Aghassibake, N. (2021). How to Create Inclusive Data Visualizations. NNERPP Extra, 3(3), 14-15. https://doi.org/10.25613/X8MX-SY34