WHAT IS YOUR DISTRICT’S COLLEGE ENROLLMENT RATE? …IT DEPENDS [PART I]
Paula Arce-Trigatti | NNERPP
Volume 1 Issue 3 (2019), pp. 2-7

In This “Research Insights” Edition
Now on to our third iteration of the “Research Insights” series – which brings together related studies from NNERPP members to explore connections across research and programs and advance our collective knowledge – we are excited to respond to “reader requests” of research areas or topics that might be of interest to examine here. For this edition, we are taking a look at college enrollment outcomes across districts participating in NNERPP through their research-practice partnership (RPP), as suggested by one of our members. As it turns out, this is a popular topic among several NNERPP members, so we have plenty to dive into!
For this particular article, we explore recent work from four of our members, who partner with four of the ten largest school districts in the U.S.:
Houston Education Research Consortium (HERC), an RPP between Rice University and a number of surrounding school districts
Los Angeles Education Research Institute (LAERI), an RPP between Los Angeles based researchers and the Los Angeles Unified School District;
Research Alliance for New York City Schools, an RPP between New York University and the New York City Department of Education;
UChicago Consortium on School Research, an RPP between the University of Chicago and Chicago Public Schools
Why This Article
We got to work reading through each partnership’s artifact, thinking this article would unfold fairly easily through a straightforward comparison of recent college enrollment rates for the four districts studied above.
… not so fast!
As we delved into each report, two things became increasingly clear: one, the construction of the sample differed in each study (i.e., who is included in the study), and two, “college enrollment” can be defined and measured in a multitude of ways. Why does this matter?
Most fundamentally, these sample and outcome definition choices matter because it means that direct comparison across all five artifacts (e.g., “What is your district’s college enrollment rate?”) is not necessarily possible. As you’ll see below, the resulting college enrollment rates can look very different, even within the same district for similar years, depending on how the sample or outcome measures are defined. More importantly, these choices reflect the underlying research question each district partner was most interested in exploring. Thus, the choice to examine college enrollment rates for high school graduates rather than high school freshmen is not accidental – each sample ultimately tells a different story with different policy implications for decision makers.
The real research insight from today’s piece then, reflected in the title, is that exploring a district’s college enrollment rate is not quite as simple as it sounds – hence, the “it depends.”
Table 1. List of RPPs + Artifacts Included in This Article
|
RPP |
ARTIFACT |
With this in mind, we’ve turned this “Research Insights” edition into two parts: In today’s article (Part I), we will examine in depth how the samples across the five studies differ and discuss how these differences might matter for policymaking. In the next issue of NNERPP Extra (Part II), we will take up an exploration of how the outcome of interest, college enrollment, differs across the studies, and the ramifications of those differences with respect to policymaking. Note that as a result, in today’s article, we are going to ignore any potential differences in how “college enrollment” is defined.
After taking this reading journey with us, we hope you leave with fresh perspectives on the connections between policy, samples, and outcome definitions. And perhaps the next time someone asks, “What’s your districts [insert statistic on any student outcome here]?” you might be prompted to respond with “it depends.” With that, let’s dive in!
Who is in the sample?
I. High School Graduates | Sample
We start with the samples utilized in the studies from the Los Angeles and Chicago teams listed above. These reports contain samples that begin with the universe of students that only include those that have graduated from high school, i.e., “high school graduates.” To be even more explicit about who is in this sample, we can take a “high school pipeline” like approach (see Table 2) that lists the key events (or possible hurdles) that students must successfully pass through in order to become the “high school graduates” that make it into these samples.
First, students must have successfully transitioned from 8th to 9th grade, which can present its own important barriers to earning a high school diploma. Factors such as transitions to new campuses, adjusting to a learning environment that includes older students, and the added pressures of performing well in preparation for college can all lead to leaks in the high school pipeline. Second, students must then have made it successfully through 9th to 11th grade to reach 12th grade. There are a variety of potential leaks that can occur during this period, perhaps too numerous to mention here. Finally, even though students may have successfully made it to 12th grade, the diploma itself could remain out of reach due to “senioritis,” for example.
Table 2. Potential high school events pipeline
| To be a high school graduate, students must have: | |||
| TRANSITIONED FROM 8TH TO 9TH GRADE SUCCESSFULLY | MADE IT THROUGH 9TH – 11TH GRADE SUCCESSFULLY AND ONTO 12TH GRADE | COMPLETED ALL OF THE REQUIREMENTS TO ACTUALLY EARN A HIGH SCHOOL DIPLOMA | |
| A potential leak, especially for those students who must transition to a new campus altogether between middle and high school; see here, here, and here, for example). | There are a number of potential leaks that can happen here (see here, here, and here, for example). | Note that you could still make it to senior year, but then succumb to the dreaded “senioritis” and fail to fulfill the requirements of the diploma. Additionally, there are two types of high school graduates we can consider: (i) “On-time”, earning the diploma in four years or (ii) simply a “graduate,” which means they might have taken longer to earn the degree. |
|
Thus, conditioning the sample to include only those students that qualify as “high school graduates” will limit the student population being examined to those that successfully made it through the high school pipeline. Moreover, it will include students that may or may not have spent the majority of their high school career at that particular school. Depending on the research question of interest, this may or may not be the right sample (more on this below).
One additional distinction we can make to this sample is the choice of whether to include only high school graduates that completed their high school career “on-time” (i.e., taking four years to complete high school) versus considering graduates more generally (i.e., students that either graduated on-time or graduated within a designated time period, often within 6 years of beginning high school). Some students may take longer than four years to complete the requirements needed to earn a high school diploma, and these students may represent a fundamentally different group than those students able to complete high school in four years. Again, depending on the research question or policy levers one is interested in exploring, this distinction will matter, as you’ll see in the later sections.
>>High School Graduates | Findings
We now turn to the findings from the Los Angeles and Chicago reports, in which the sample is defined as “high school graduates” (see Figures 1 and 2). Both reports include findings for the class of 2008 and the class of 2014. Note that neither report includes samples restricted to “on-time” graduates; rather, the samples contain any student that graduated high school in 2008 or 2014.
You might be wondering why we didn’t include them in the same graph, and instead, made a separate graph for each city. Because we haven’t explored how each study defines “college enrollment,” we actually can’t be certain whether these statistics are indeed comparable. Thus, we encourage readers to take in each study separately, and moreover, visit each report to get a full breakdown on how to interpret these findings.
Figure 1: College Enrollment in Los Angeles: % of High School Graduates
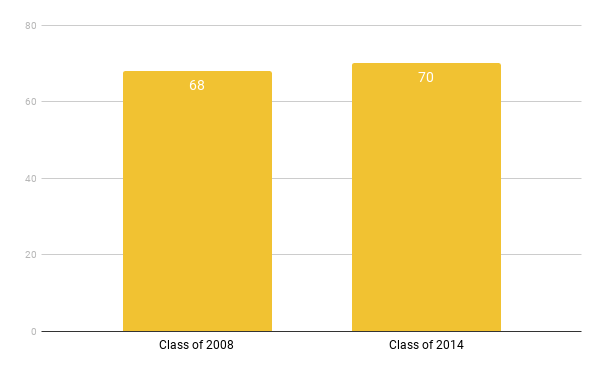
Figure 2: College Enrollment in Chicago: % of High School Graduates
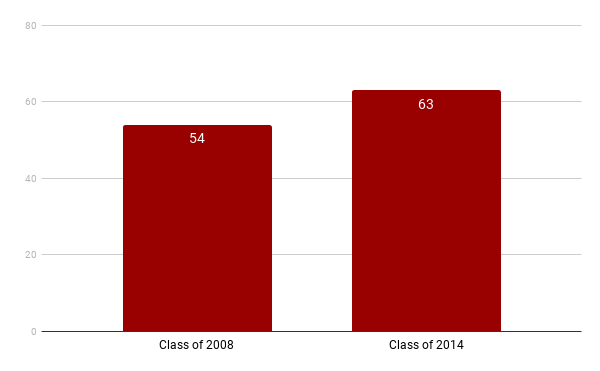
For now, we simply note that the college enrollment rate for Los Angeles appears rises slightly between the two cohorts considered, while the college enrollment rate appears to experience an important increase for Chicago students over the two time periods. For more information on the why behind the findings, please see here for Los Angeles and here for Chicago.
>>High School Graduates | Implications
From a policy perspective, limiting the sample to high school graduates (whether on-time or not) makes sense if one is most interested in studying how well the transition between high school and immediate college enrollment is going. For example, a district might be interested in knowing whether students are being prepared, towards the end of high school, to actually make this transition (e.g., are district or school strategies helping students find the right college, fill out applications, participate in relevant financial aid opportunities, etc.). Note again, though, that this sample is likely to include some students that may not have spent much time in that particular school, so this will need to be taken into account when interpreting the results.
Another common policy lever that has surfaced in the research literature is the idea of “summer melt” – i.e., students who have successfully earned a high school diploma and demonstrated an intent to enroll in college, but for a variety of reasons, do not actually enroll in college. Note that samples studying summer melt, however, are even more narrow than the “high school graduates” samples included here, since they only include students demonstrating an intent to attend and omit those with no intent.
In any case, restricting a sample to only those students that are considered “high school graduates” does not necessarily address the three events (or possibly four events, if we count “on-time”) students must successfully pass through in order to become “high school graduates.” For this reason, we might consider broadening the sample to include additional students that don’t meet these benchmarks as the next two samples do, which may result in another set of potential policy levers to consider.
II. High School Seniors | Sample
We next turn to the Houston study, which considers any student that was a 12th grader in the fall of a particular year in its base sample. If we utilize our high school event pipeline described earlier, this means that students in this sample: (i) transitioned from 8th to 9th grade successfully and (ii) made it through 9th – 11th grade successfully and onto 12th grade. In addition to its 12th grade analysis, the Houston report also looks at high school graduates from their base sample, i.e., those students that additionally earned a diploma. Note that this second sample is not comparable to the Los Angeles or Chicago studies mentioned in the section above since the starting point for each sample differs – here, we begin with all 12th graders. In the samples above, they begin with all high school graduates
This difference is important, as we’ll see below. Because the 12th graders sample is more inclusive than reporting on high school graduates only, we would thus expect the resulting rate of college enrollment to generally be lower, as it reflects a portion of students that despite making it to 12th grade, did not in fact earn a high school diploma. One additional item to note specific to the Houston sample is that the study pools together three years of data rather than providing a single metric per year. This masks trends that might appear over time and speaks instead to an average for the time period under consideration.
>>High School Seniors | Findings
Consistent with our expectations, we see that the rate of college enrollment for high school seniors, which includes all 12th graders in the 2006, 2007, and 2008 cohorts, is indeed lower than what is found for high school graduates during this same time period (see Table 3 below).
Table 3. Houston Study Findings
|
HOUSTON | College Enrollment for High School SENIORS versus GRADUATES |
|||
|
High School SENIORS in 2006-2008 |
High School GRADUATES in 2006-2008 | ||
|
46% |
56% | ||
|
N = 27,074 |
N = 22,295 | ||
>>High School Seniors | Implications
From a policy perspective, including the entire cohort of 12th graders in the sample rather than limiting it to just those that graduated high school may give you a better sense of what supports might be helpful in the final stretch of high school. Between choosing which colleges to apply to, actually applying, making sure you’ve taken the appropriate entrance exams (and exit exams), and continuing to show up to classes (and pass them!), there are a number of reasons why 12th graders may not actually make it across the high school diploma finish line. Broadening the sample to include all 12th graders can thus help policymakers discern the extent to which high school seniors–more generally – are successfully enrolling in college.
III. High School Freshmen | Sample
Finally, the two studies with the most inclusive sample of the group (i.e., has the fewest number of restrictions for which students make it into the sample) are the two from New York City, which include this blog post and this full report. Both artifacts consider 9th grade students within a given cohort as the starting point for their samples. Connecting back once more to our high school event pipeline (Table 2), this means that, to be included in this sample, students must have: (i) transitioned from 8th to 9th grade successfully.
Where the two products diverge is in the construction of the college enrollment rate itself. To calculate this rate for 9th graders, one has to make a call about how far out to look to see if a student enrolled in college or not. By default, to enroll in college a student must have graduated high school. Intuitively, then, one might first look at how many students enroll in college after completing high school within four years of starting 9th grade. This is the “on-time” graduation rate we discussed earlier, and is how the college enrollment rate is constructed for the NYC blog post. We can also be less restrictive about who is in the sample and instead, allow for those students that might take an additional year or two to graduate high school. Another potential cutoff point might thus be to look at college enrollment for those students who graduate high school within 6 years. The findings from the NYC full report use this as the cutoff.
As we’ll see shortly, this decision point has implications for what the numbers then tell us (i.e., you won’t get the same college enrollment rate, despite using data from the same district, over the same time period, with the same definition for “college enrollment”). Allowing the sample to additionally include students who may have taken up to six years to earn a high school diploma will most likely result in a higher college enrollment rate, all other things equal. This is because the sample captures the additional students that enroll in college, even though they have a slightly delayed high school graduation.
More generally, however, because the sample now begins with students in 9th grade as opposed to those in later grades, we would expect a lower college enrollment rate to result overall. Previously we noted the general expectation for the college enrollment rate to be lower for high school seniors relative to high school graduates. Here we note a similar expectation: the college enrollment rate for high school freshmen is likely to be relatively lower than what we might find for high school seniors or graduates. Given that the notion of college is four years away for this group of students, this should be unsurprising. The longer time horizon from 9th grade → 12th grade → high school graduate → college enrollment may introduce greater chances of students dropping out of the pipeline, leading to lower overall college enrollment rates for this group.
>>High School Freshmen | Findings
Figure 3 contains the findings from the NYC blogpost that uses the 4-year high school graduation rate in their construction of the college enrollment rate. Figure 4 contains the findings from the NYC full report that uses the 6-year high school graduation rate in their construction of the college enrollment rate.
Figure 3. College Enrollment: % of 9th graders in NYC who enroll in college by the fall after 4th year
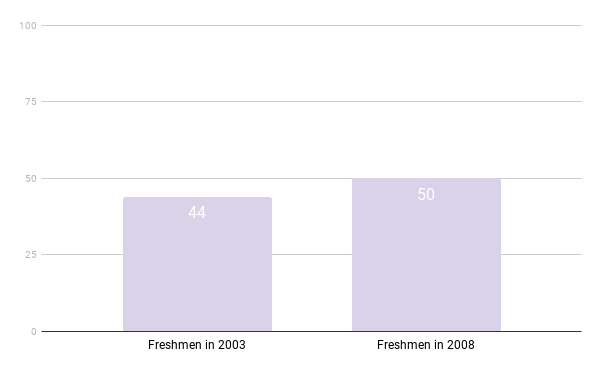
Figure 4. College Enrollment: % of 9th graders in NYC who enroll in college by the fall after 6th year
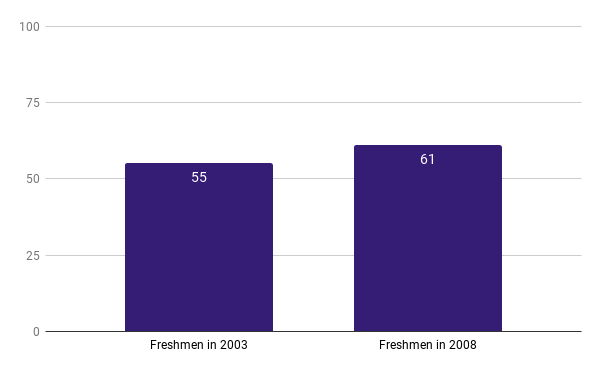
As expected, we see that the college enrollment rate for 9th graders using a 4-year high school graduation cutoff point (Figure 3) is indeed lower overall than when the 6-year high school graduation rate is used (Figure 4).
>>High School Freshmen | Implications
From a policymaking perspective, the choice to condition the sample on high school freshmen may allow for a greater number of policy levers to consider. If the research question of interest is more about how high school experiences contribute to college enrollment, for example, then this is the population of students that must be included in the sample.
For a terrific visualization of how selecting this sample may help frame policy considerations, we highly recommend readers take a look at Figure ES-1 from the NYC full report, which maps out the potential pathways a student from the 9th grade cohort might take to college enrollment. This graphic, together with the entire report–which introduces a conceptual framework for how to approach questions related to college enrollment–is a must-read for policymakers interested in studying this topic further.
Closing Thoughts
As we’ve seen in this article, a district’s college enrollment rate can differ quite a bit depending on who is in the sample. Moreover, the resultant findings from a research study can also have vastly different implications for policy given the sample. We thus strongly encourage readers of research to first take a closer look at the conditions defining which students ultimately were included in the analysis, since it’s not always clear that simple comparisons can be made on similarly labeled outcomes. Likewise, we also strongly encourage producers of research to carefully consider who has to be in the sample and why, especially as it relates to the needs of the end user, and clearly communicate any potential implications from these decisions.
We hope you’ll return for Part II of this series (to be published in the next edition of NNERPP Extra), where we’ll take a deep dive into understanding how the outcome of interest, college enrollment, is defined across the five studies, as well as the possible implications for policy. As you might have already guessed, the answer is “it depends”!
Paula Arce-Trigatti is Director of the National Network of Education Research-Practice Partnerships (NNERPP).
Suggested citation: Arce-Trigatti, P. (2019). What is Your District’s College Enrollment Rate? …It Depends [Part I]. NNERPP Extra, 1(3), 2-7.
NNERPP | EXTRA is a quarterly magazine produced by the National Network of Education Research-Practice Partnerships | nnerpp.rice.edu